Council of Foreign Relations: Women’s Workplace Equality Index
Go to cfr: Women’s Workplace Equality Index

PROJECT OVERVIEW
My Role
UX, Data Viz sketch (with RStudio) at AREA 17
Team
Director of Product Strategy, Laura Sanchez; Producer, Jesse Bennett; Visual Designer, Tim Sullivan
UX, Data Viz sketch (with RStudio) at AREA 17
Team
Director of Product Strategy, Laura Sanchez; Producer, Jesse Bennett; Visual Designer, Tim Sullivan
Objective
We worked closely with the Council of Foreign Relations(CFR) to create a micro site that showcases the data of legal barriers women face in the workforce in each country. The goal was to translate complex data into easy to digest information, which can serve as a powerful tool to push for legal reform and gender parity.
We worked closely with the Council of Foreign Relations(CFR) to create a micro site that showcases the data of legal barriers women face in the workforce in each country. The goal was to translate complex data into easy to digest information, which can serve as a powerful tool to push for legal reform and gender parity.
PRIMARY USERS
Policy makers and activists who push for legal reform.
Each country has its own distinct score on seven indicators that represent legal gender parity. Each indicator is measured with one or two sets of questions, such as “Can women choose were they want to live like men do”. Showcasing details of what laws are preventing women from participating in the workforce can serve as supporting evidence for policy makers and activists to fight for certain causes.
Each country has its own distinct score on seven indicators that represent legal gender parity. Each indicator is measured with one or two sets of questions, such as “Can women choose were they want to live like men do”. Showcasing details of what laws are preventing women from participating in the workforce can serve as supporting evidence for policy makers and activists to fight for certain causes.
CHALLENGES & OPPORTUNITIES
Challenge
The greatest challenge of this project was the heavy data & time constraint. There were many important facts and data points crucial to helping the user understand the breadth and depth of the problem.
The greatest challenge of this project was the heavy data & time constraint. There were many important facts and data points crucial to helping the user understand the breadth and depth of the problem.
Opportunity
The website should encourage countries to take action and avoid negative shaming. It was important to emphasize that the issue is a global problem with a positive tone, and that even the the top ranking countries have something to improve.
The website should encourage countries to take action and avoid negative shaming. It was important to emphasize that the issue is a global problem with a positive tone, and that even the the top ranking countries have something to improve.

Testing Data in R & CartoDB
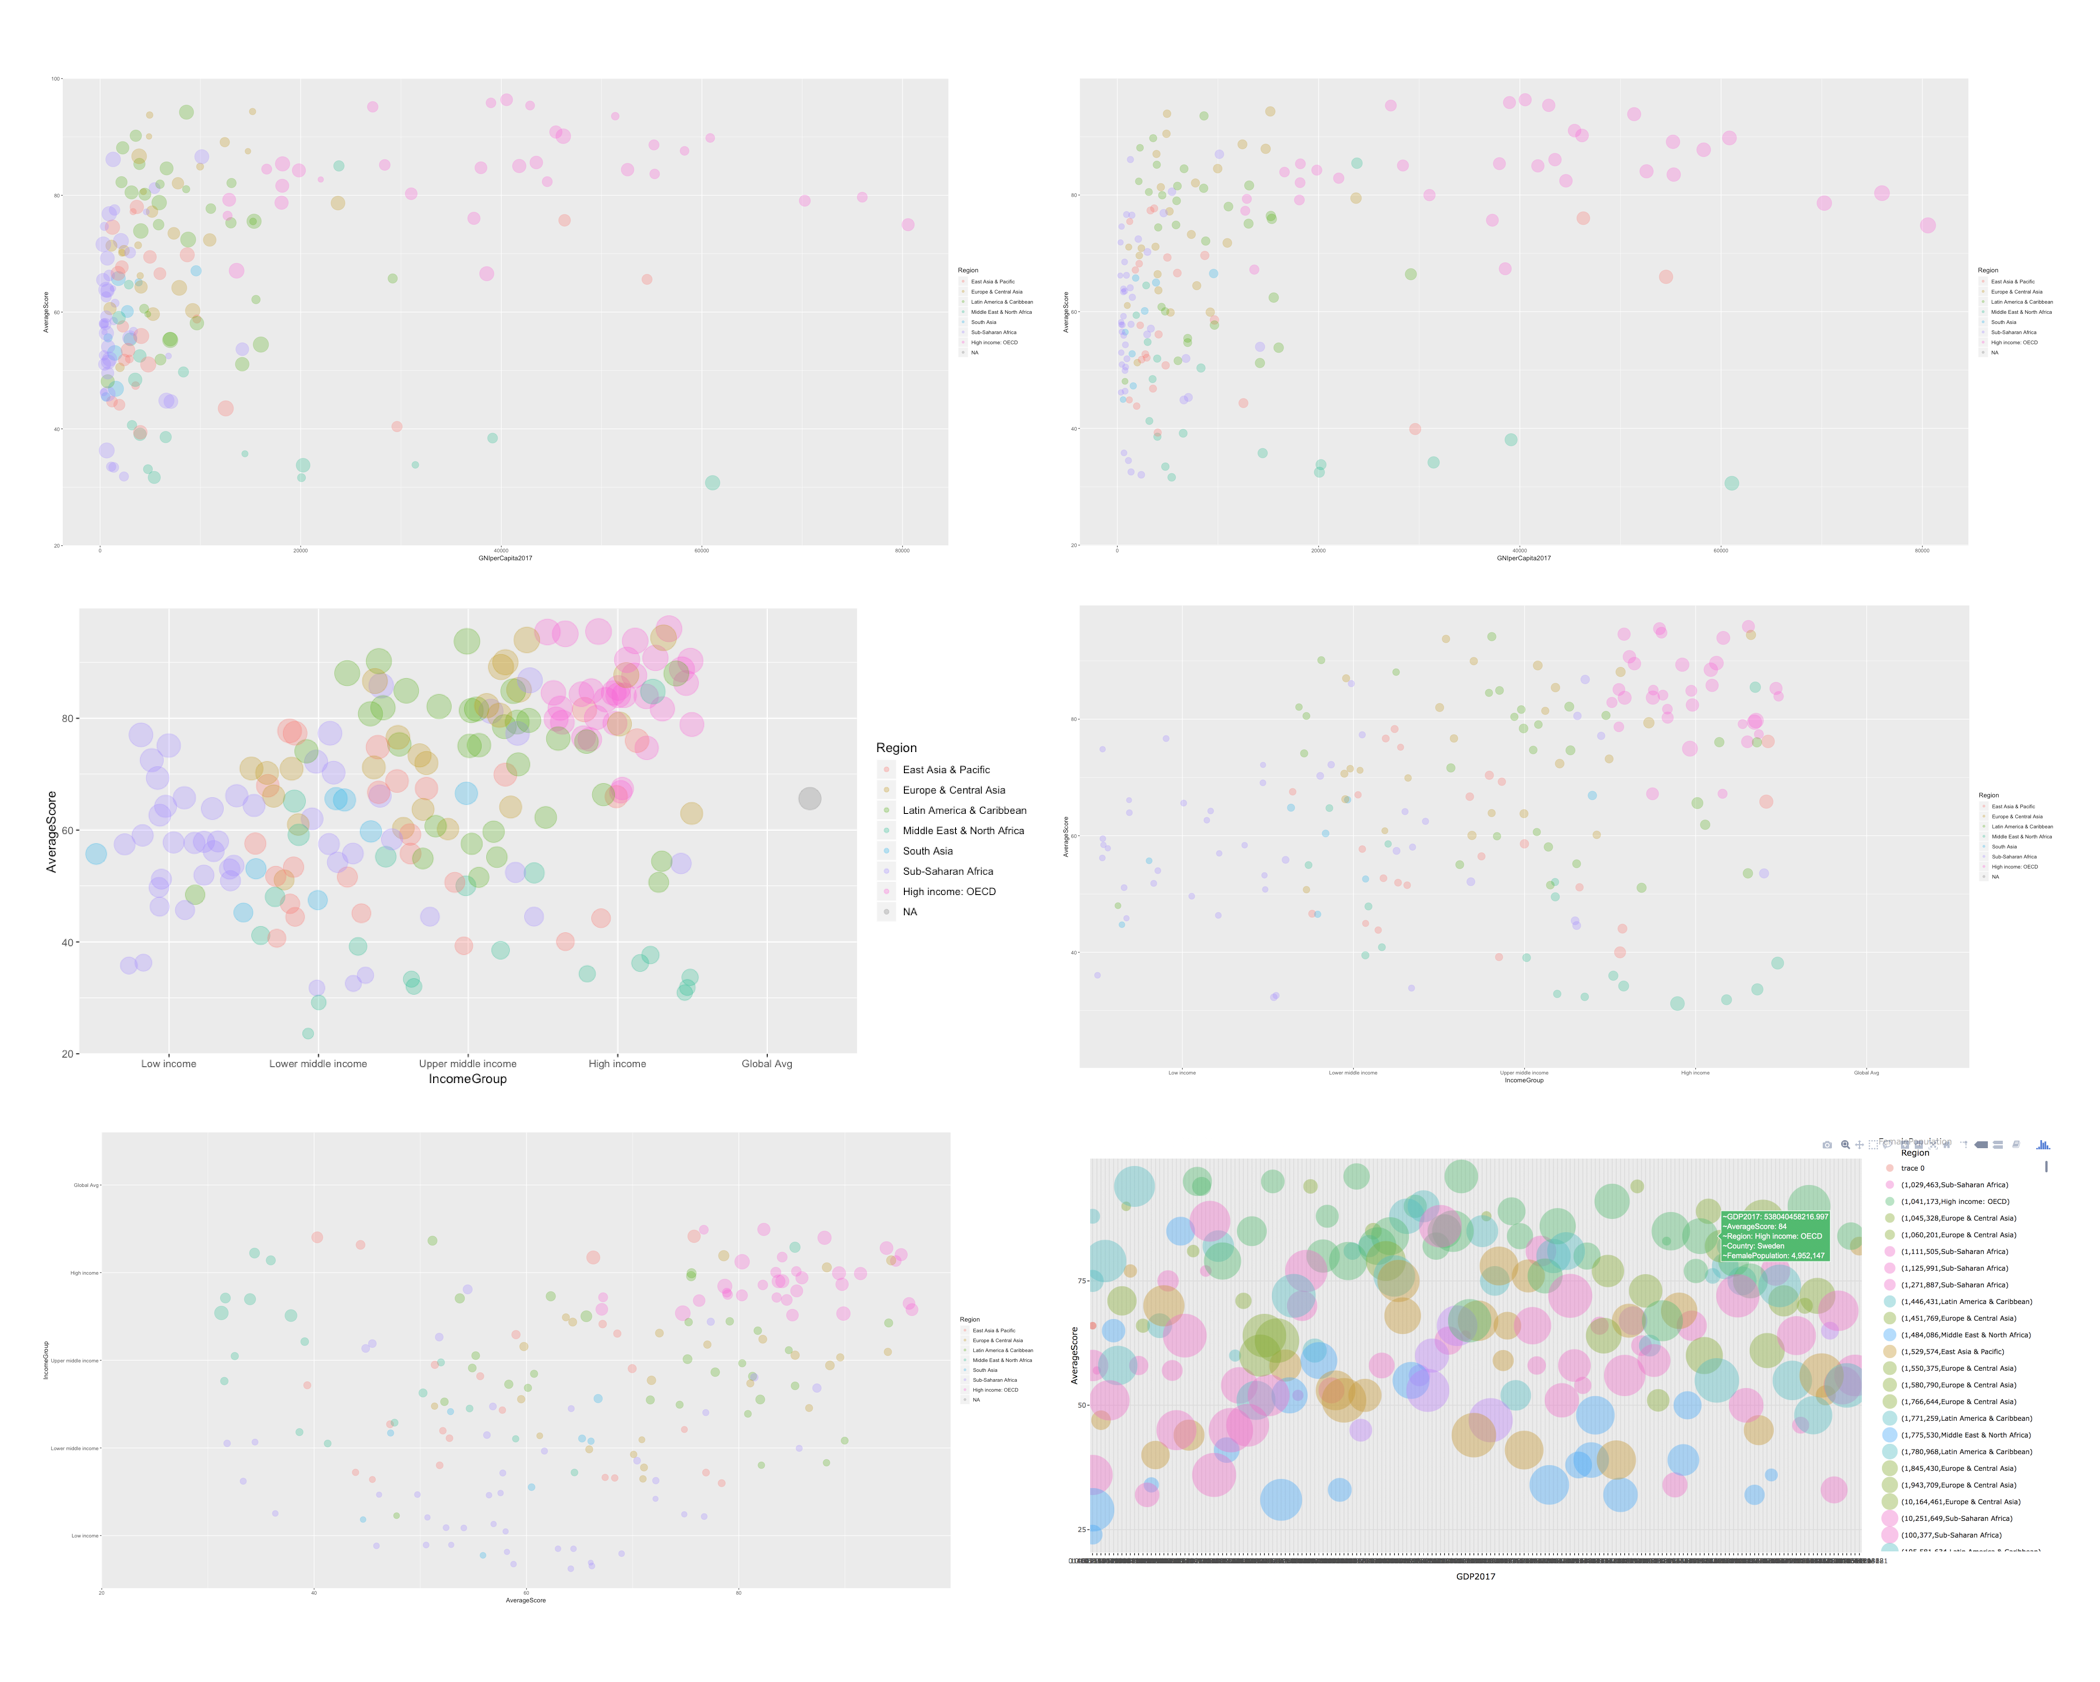
We had a short amount of time to complete UX so I immediately jumped in with testing the dataset. I used RStudio to visualize different combinations of variables for a bubble chart, and CartoDB to map data by country location. Working towards finding the strongest variable combinations and best visualization options for what story we want to tell.
Visualizations in RStudio (Exports in Rpub)
![]()
CartoDB mapping:
1. Bubble on map - color: score group, size: female population
2. Color by Average Score
3. Color by Income Group (Exports)
Visualizations in RStudio (Exports in Rpub)

CartoDB mapping:
1. Bubble on map - color: score group, size: female population
2. Color by Average Score
3. Color by Income Group (Exports)
WIREFRAMES 1-Week
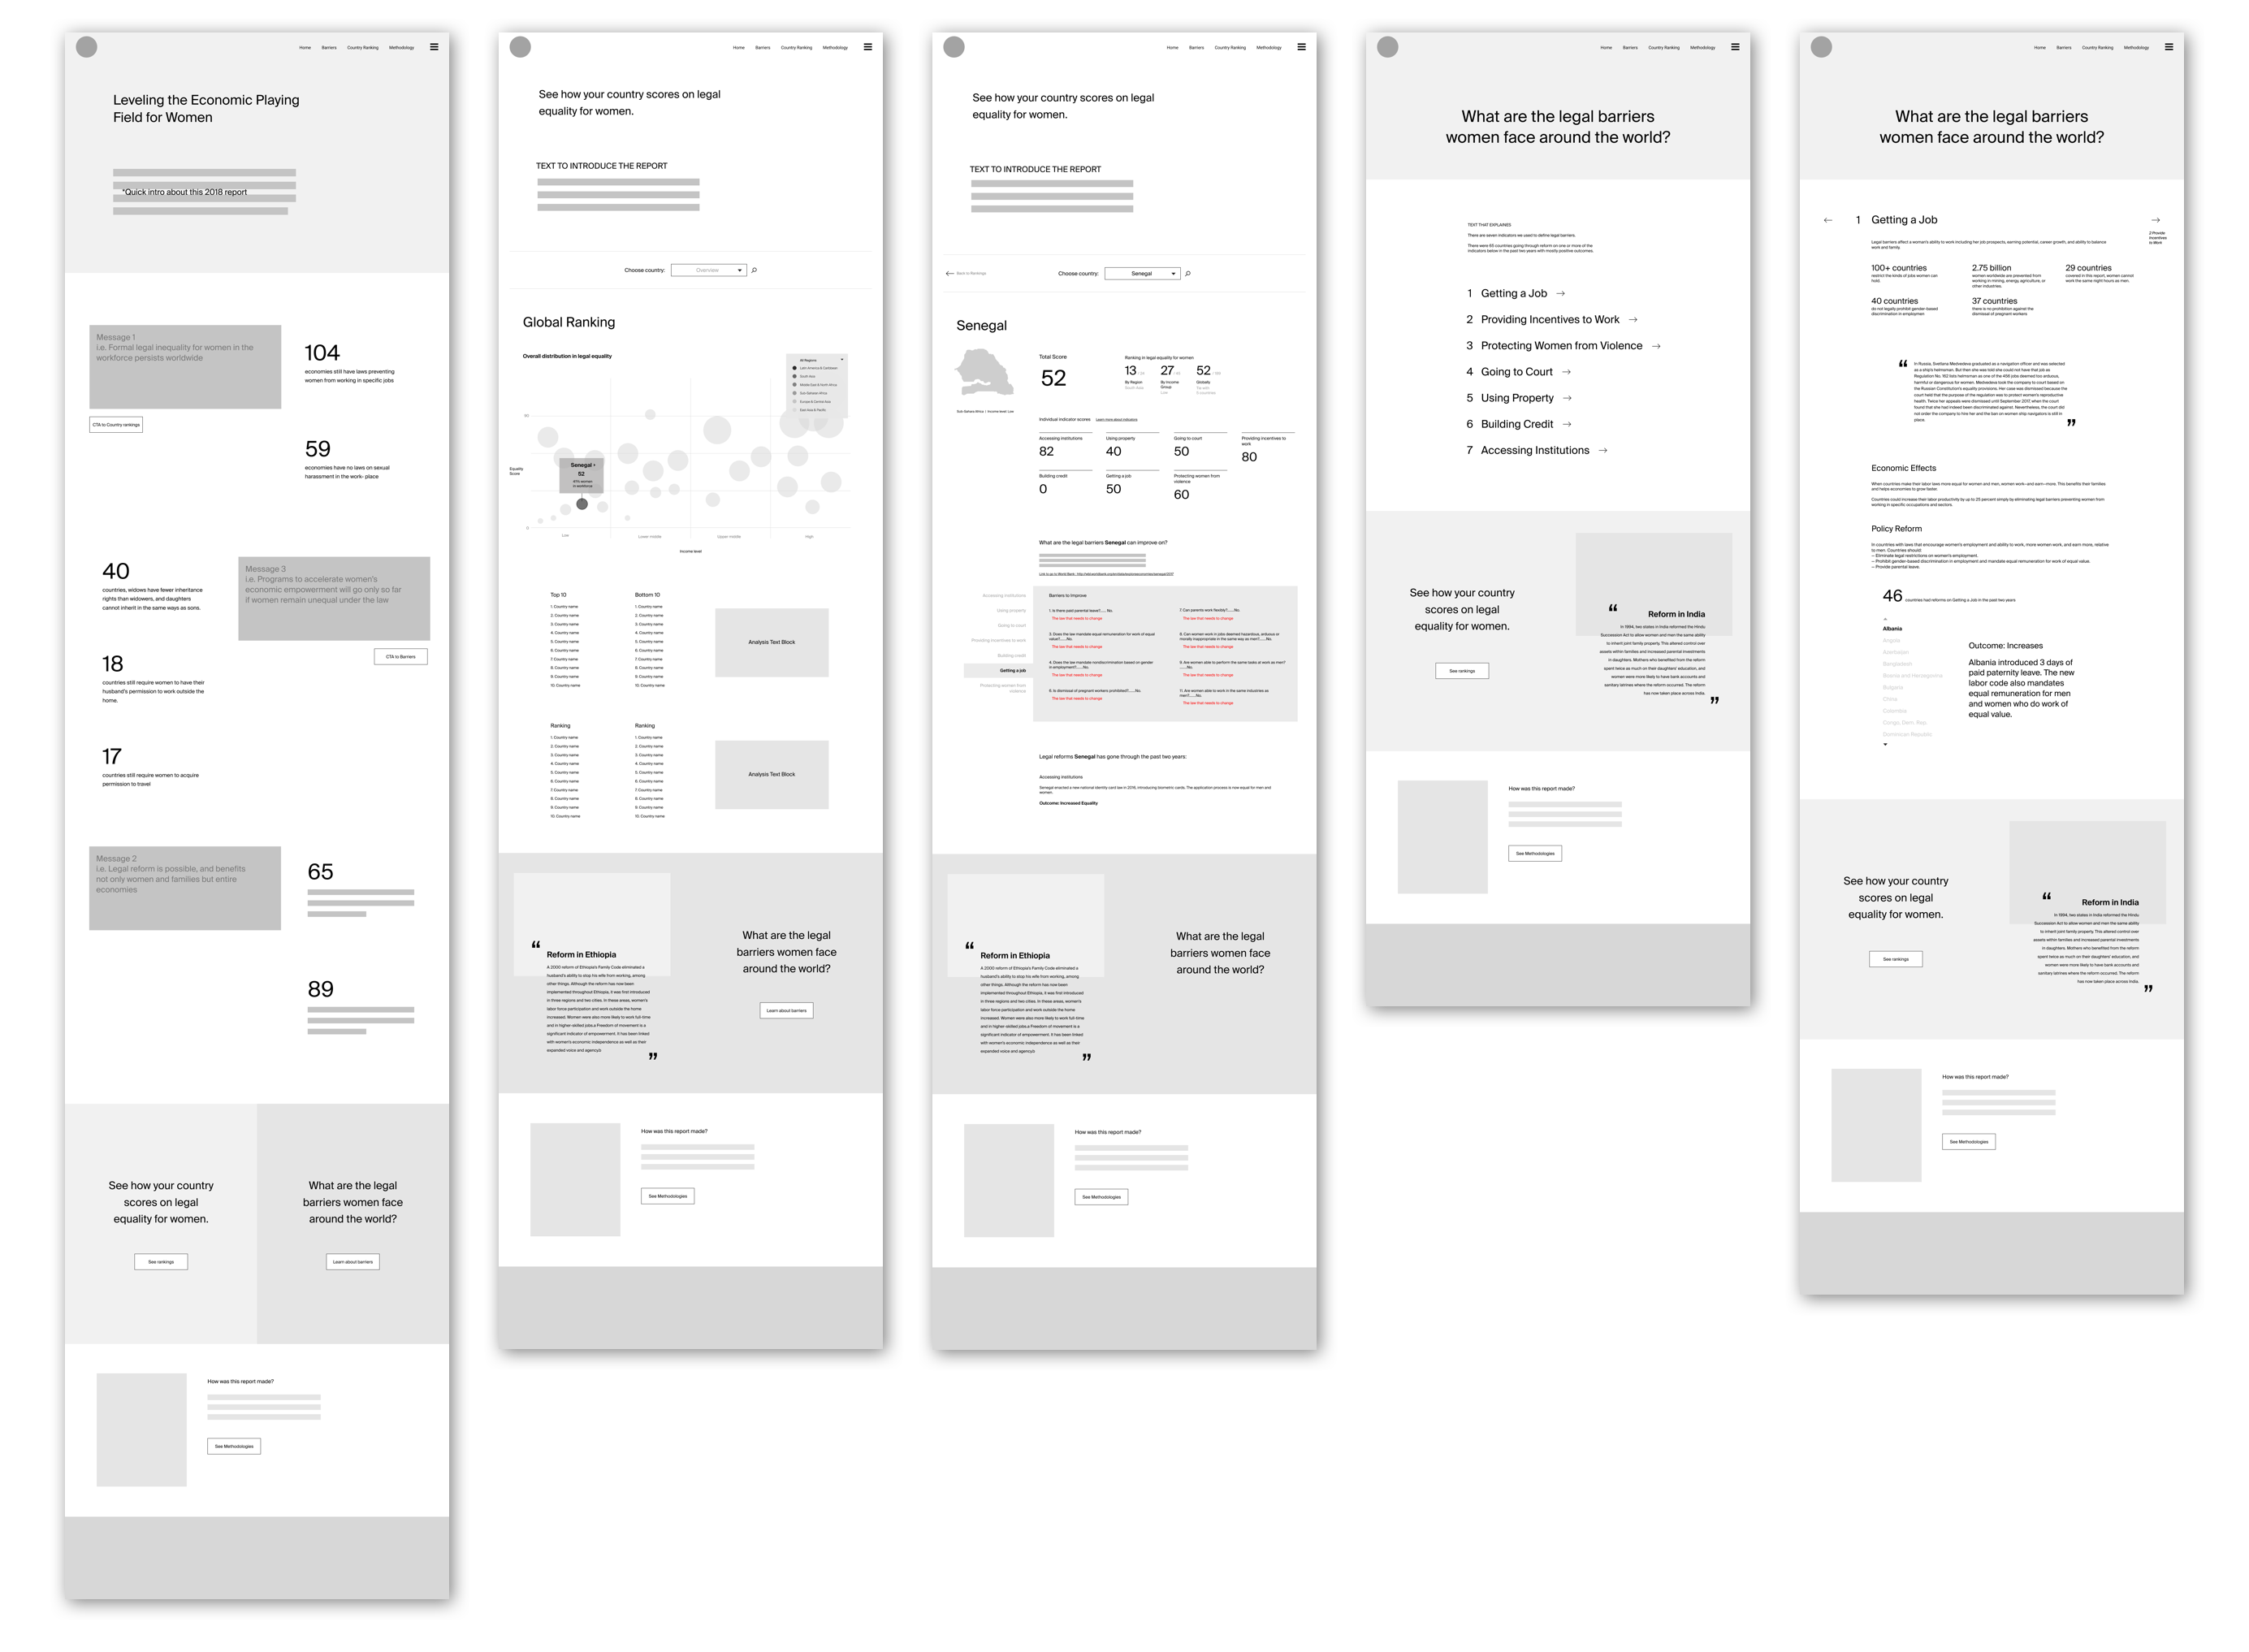
With a one week timeline, I made one round of wireframes as a starting point to discuss details with the clients.
![]()

UX & Visual Design Collaboration
Due to time constraint, visual design and I worked alongside to jumpstart data visualization. Through exploring the dataset, we identified three levels of information needed to communicate the full story:
Global Facts
The website experience would begin with introducing barriers across the world.
The website experience would begin with introducing barriers across the world.

Global Data
It is human nature to compare. Having in mind to avoid country shaming, we still wanted to encourage users by showing at a glance how all countries are doing.
Beginning with Top 10 & Bottom 10
It is human nature to compare. Having in mind to avoid country shaming, we still wanted to encourage users by showing at a glance how all countries are doing.
Beginning with Top 10 & Bottom 10

Followed by a filterable list of the full ranking
The users can decide if they want to play around with the data on the global level, or dive immediately into a specific country. Which brings us to the third level.
The users can decide if they want to play around with the data on the global level, or dive immediately into a specific country. Which brings us to the third level.

Country Data
This page shows a comprehensive view of how the country is doing, where it lands in its region, and the actual barriers that contributed to the score.
Starting with the country overview:
This page shows a comprehensive view of how the country is doing, where it lands in its region, and the actual barriers that contributed to the score.
Starting with the country overview:

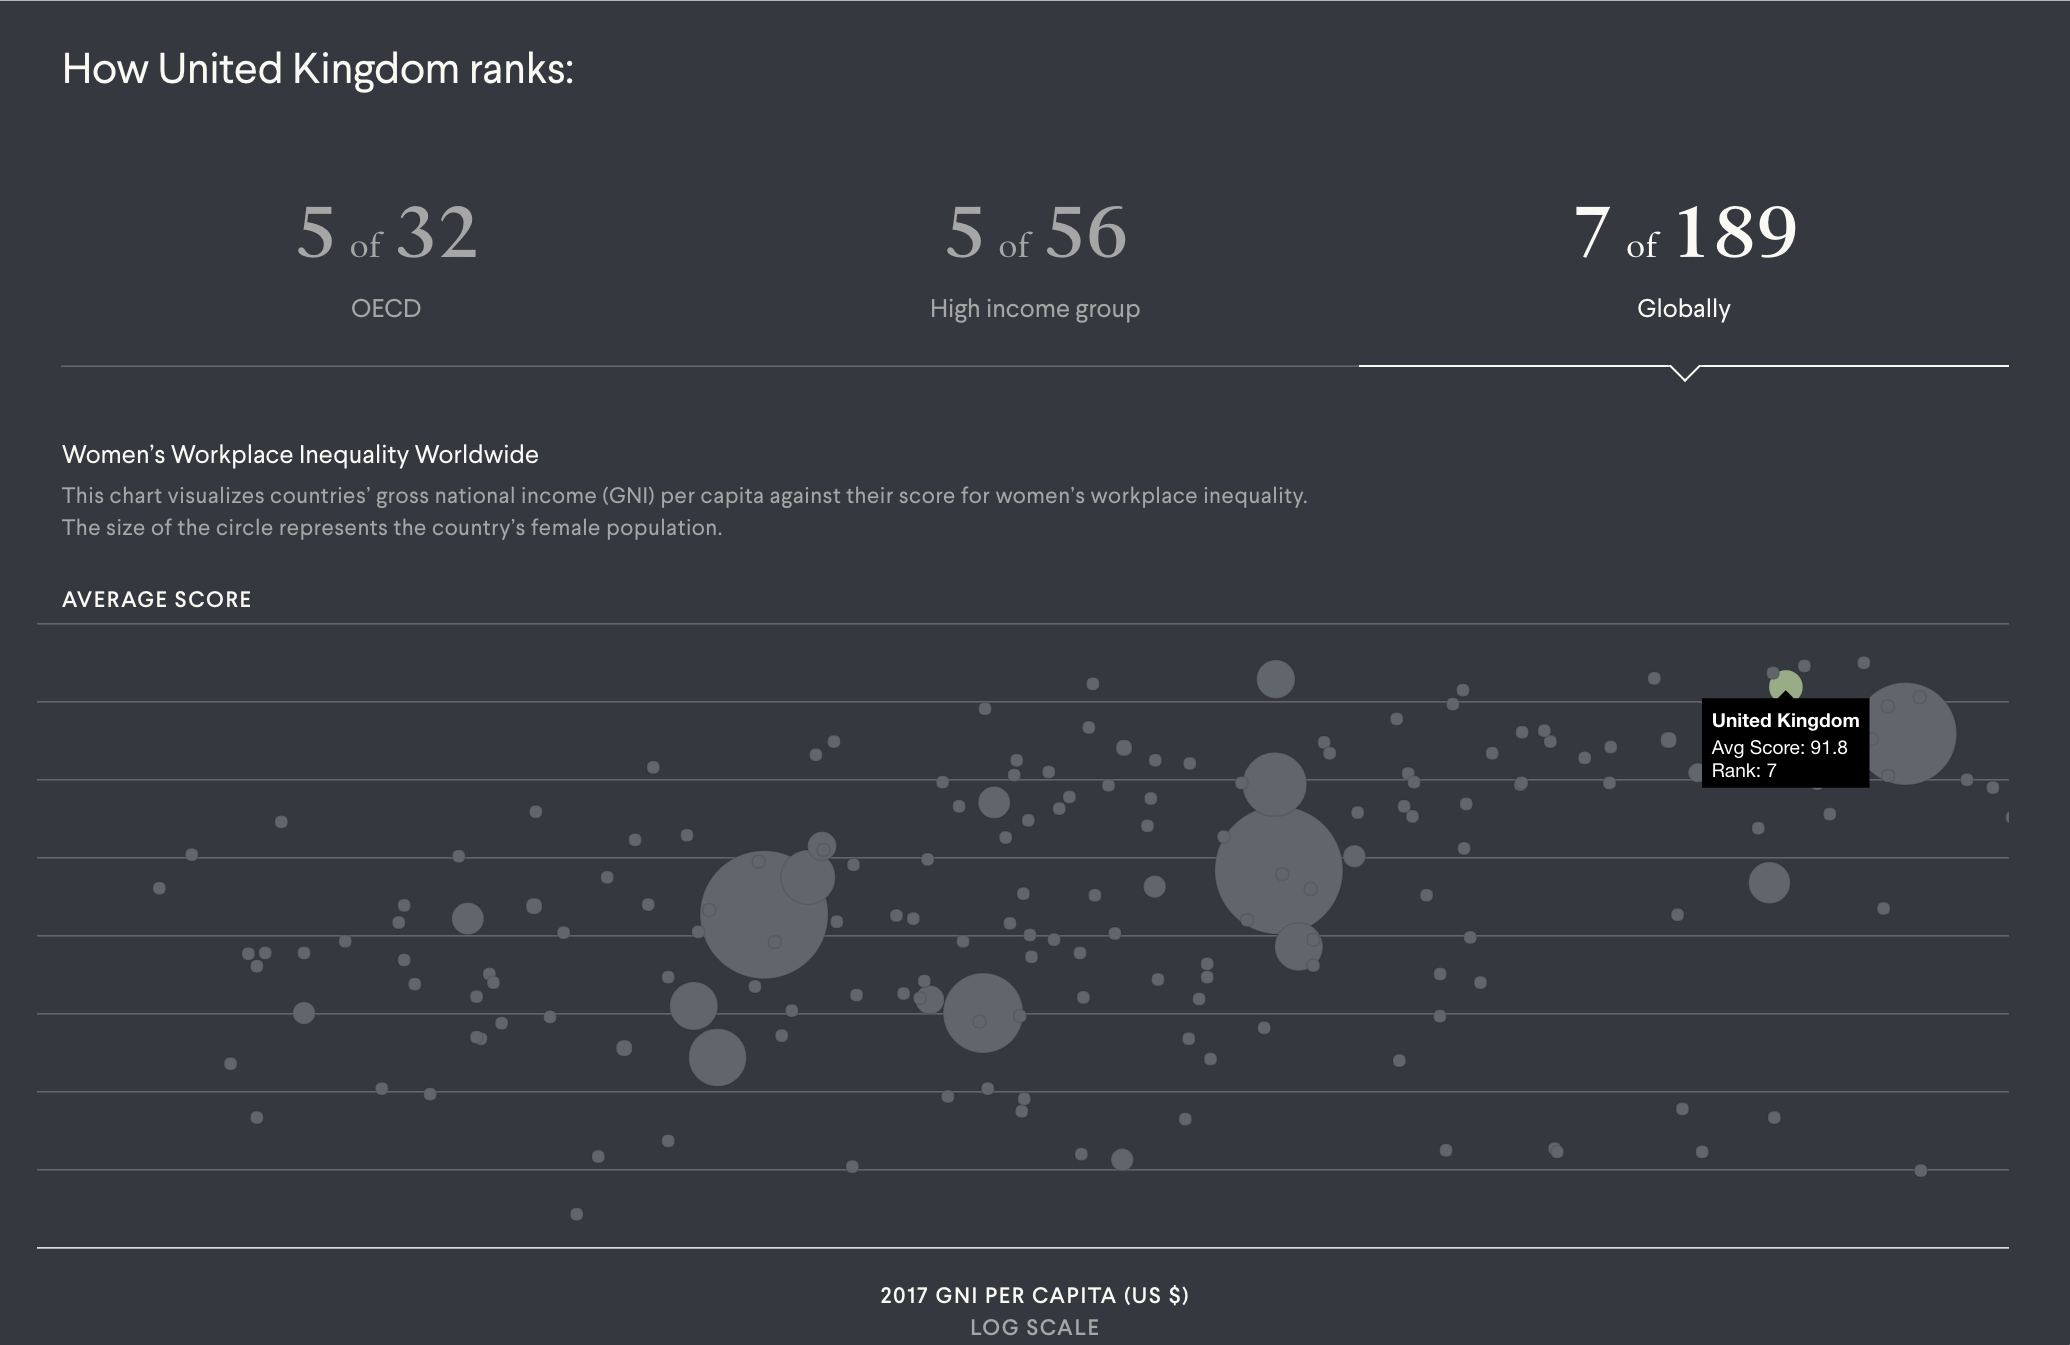
Followed by a bubble chart of where the country lands globally, in its region, and in its economical group:

LAUNCH DATE
cfr: Women’s Workplace Equality Index launched in October 2018
A sister site was launched at the same time — cfr: Growing Economy Through Gender Equality. Designed by the same team. Case study coming soon.
A sister site was launched at the same time — cfr: Growing Economy Through Gender Equality. Designed by the same team. Case study coming soon.